Analytics & Reports
41+ business intelligence reports and real-time analytics to make data-driven decisions
✓ No credit card required • ✓ Setup in 10 minutes
What is Analytics & Reports?
Zentiya's Analytics & Reports gives you comprehensive business intelligence with 41+ report types covering sales, inventory, customers, finances, and operations. Real-time dashboards, customizable date ranges, and actionable insights help you make data-driven decisions to grow your retail business faster.
Track everything that matters: sales performance by product/category/store, inventory turnover and dead stock, customer retention and RFM analysis, employee performance, payment method breakdown, profit margins, and discount effectiveness. Visual charts, trend analysis, and forecasting help you spot opportunities and prevent problems before they happen.
All plans include essential reports like daily sales summary and basic analytics. Professional and Premium plans unlock advanced reports including sales forecasting, customer segmentation, ABC inventory analysis, and custom report builder. Export any report to Excel/PDF, schedule automated email delivery, and share with your team. Every report updates in real-time as transactions flow through your system.
Everything Included
Comprehensive business intelligence for retailers
Sales Reports
15+ sales reports including performance by product, category, store, time period, and payment method. Discount and refund analysis.
Inventory Reports
Stock levels, turnover rates, dead stock identification, ABC analysis, reorder suggestions, and inventory valuation reports.
Customer Analytics
RFM segmentation, customer lifetime value, retention rates, acquisition costs, churn analysis, and loyalty program performance.
Financial Reports
Profit & loss, balance sheet, cash flow, revenue trends, expense tracking, and profitability by product or store.
Sales Forecasting
AI-powered sales predictions based on historical data and trends. Forecast demand for optimal inventory planning.
Product Performance
Top sellers, slow movers, profit margins by product, category performance, and product mix optimization insights.
Store Comparison
Compare performance across multiple locations. Sales, profit, inventory turnover, and employee productivity by store.
Employee Performance
Sales per employee, transaction counts, average order value, and performance rankings. Identify top performers.
Payment Method Analysis
Breakdown of sales by payment type (cash, card, UPI, wallets). Transaction fees analysis and preferred payment trends.
Custom Reports
Build custom reports with drag-and-drop report builder. Select metrics, filters, and visualizations. Save and reuse templates.
Scheduled Reports
Schedule reports to email automatically—daily, weekly, or monthly. Stay on top of important metrics. Share with team automatically.
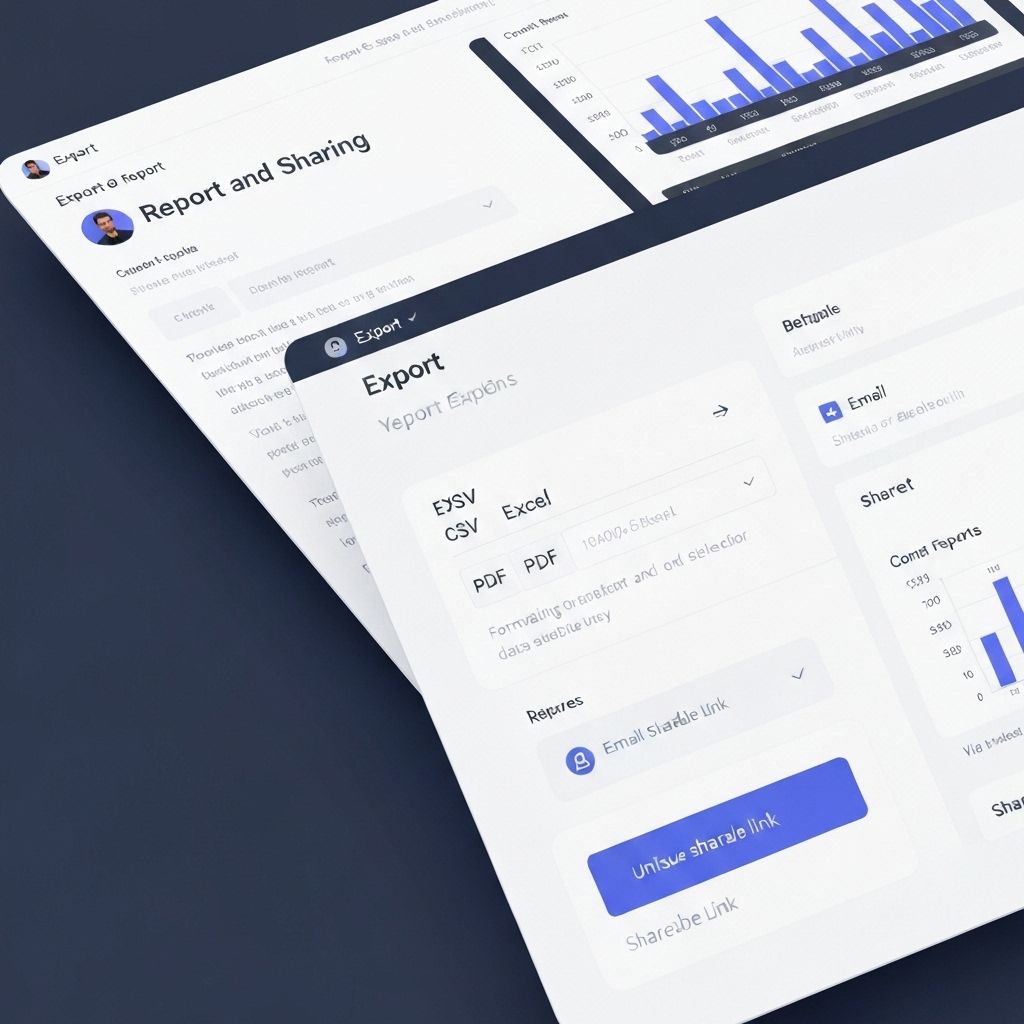
Export & Share
Export any report to Excel, PDF, or CSV. Share via email, download for presentations, or print for meetings.
How It Works
Real-Time Data Collection
Every transaction, inventory change, and customer interaction is captured automatically. Data flows into analytics engine in real-time.

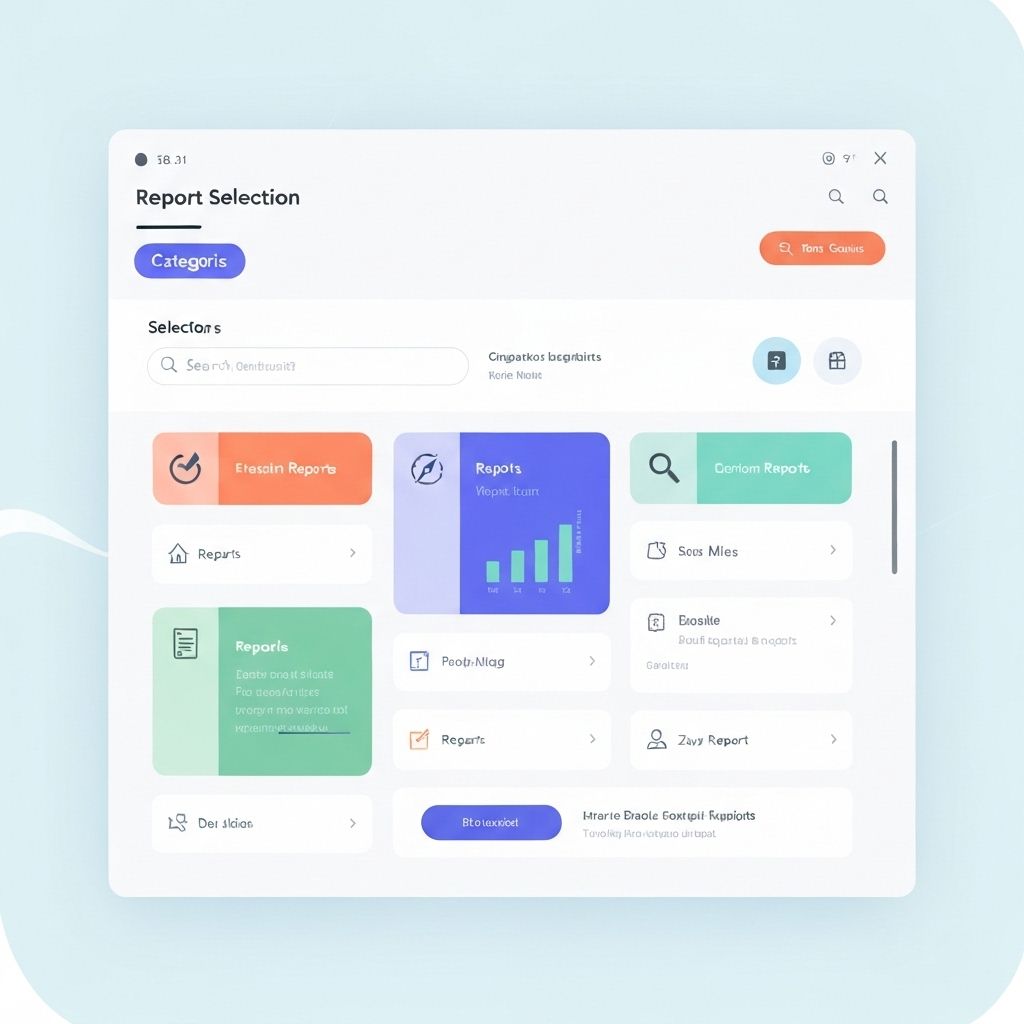
Choose Your Report
Browse 41+ pre-built reports organized by category: Sales, Inventory, Customers, Financial, or Operational. Select date range and filters.
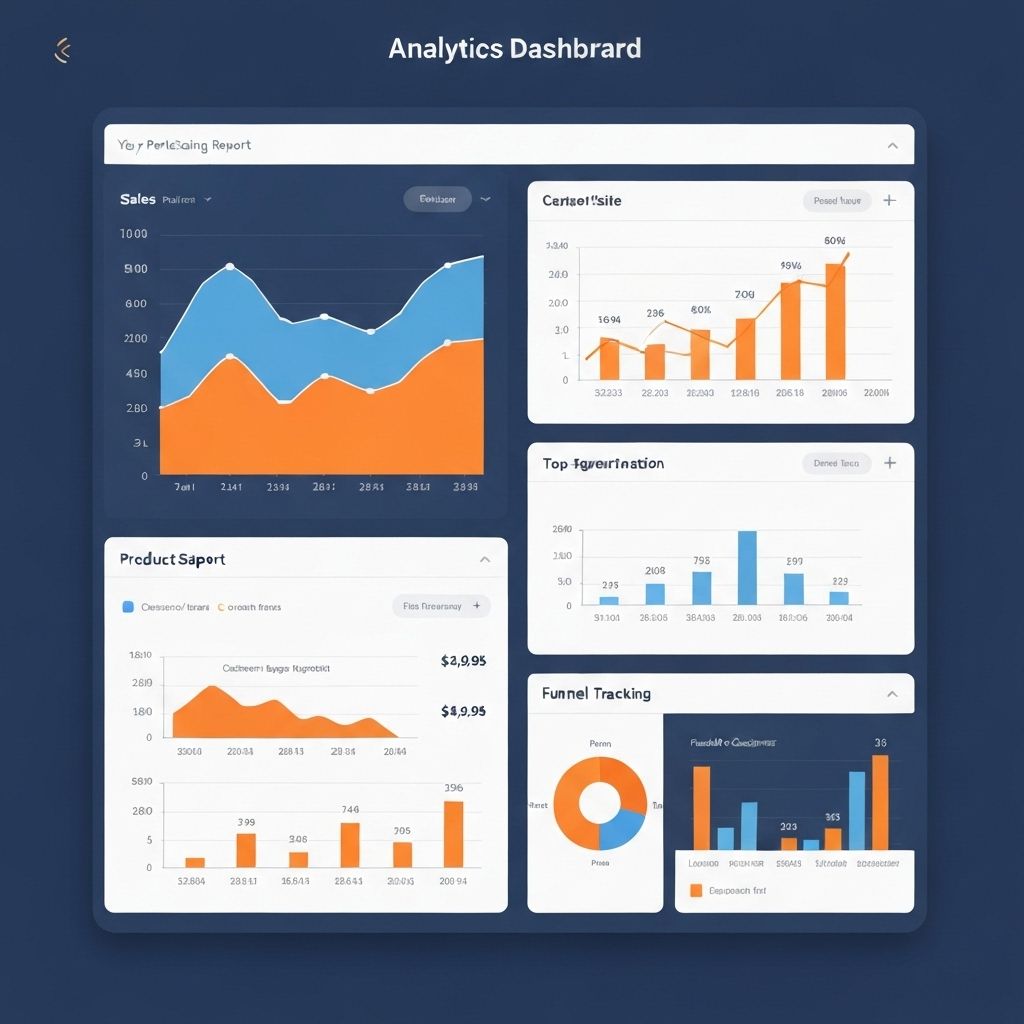
Analyze Insights
View visual charts, trend lines, and key metrics. Drill down into details, compare time periods, and identify patterns and opportunities.
Take Action
Export reports, share with team, schedule automated delivery, or create custom alerts. Use insights to optimize operations and boost profits.
Perfect For
Business intelligence for every retail operation
Store Managers
Daily sales summaries, inventory alerts, employee performance, and operational metrics. Make quick decisions to hit daily targets.
Business Owners
High-level overview of profitability, cash flow, growth trends, and store comparisons. Strategic insights for business expansion.
Financial Controllers
P&L statements, balance sheets, cash flow reports, expense analysis, and budget tracking. Complete financial visibility.
Inventory Managers
Stock levels, turnover rates, reorder suggestions, dead stock identification, and supplier performance. Optimize inventory investment.
Marketing Teams
Customer segmentation, campaign performance, product preferences, and loyalty program analytics. Data-driven marketing decisions.
Multi-Store Chains
Consolidated and store-wise reports. Regional performance, best practices identification, and chain-wide optimization insights.
Works With Your Tools
Seamlessly integrated with your business systems
POS System
Real-time data
Inventory System
Stock data
Accounting
Financial data
CRM
Customer data
Excel/CSV
Export
Reports
Scheduled delivery
BI Tools
Advanced analytics
Common Questions
Ready for Data-Driven Insights?
Start your 14-day free trial. No credit card required.
Join our early access program